Image


The results of the biodiversity footprint -project offered lots of interesting information on nature impacts and countless development opportunities.
During spring 2024, the biodiversity footprint of 13 municipalities was calculated. The biodiversity footprint is an indicator of the impact people, municipalities or an organization has on the decline or restoration of biodiversity and the main causes leading to this impact. Just as our carbon footprint measures our impact on global warming, our biodiversity footprint measures our impact on biodiversity.
Biodiversity footprint calculations are a relatively new thing and calculation methods are constantly developing. The calculation involves several uncertainties. We do not have comprehensive data on all consumption within the municipal boundaries. Further, we do not know e.g. how coffee consumed in Finland has burdened nature or caused greenhouse gas or nutrient emissions in all its different production countries.
Using global databases, it is possible to estimate an average impact. The biodiversity footprint provides us with information on the calculated average: on average, a certain type of activity or consumption causes such natural impacts in this location. In other words, the method produces as accurate a calculation result as is possible with the data currently available. In future, if more accurate data is available, the average figures in databases can be replaced with information on actual land use, emissions, and other impacts on nature.

In order to calculate the biodiversity footprint, it is necessary to identify actions that have an impact on nature and biodiversity. The international panel IBPES has identified five divers of biodiversity loss: 1) changes in land and sea use, 2) use of natural resources, 3) climate change, 4) pollution and 5) invasive species.
The biodiversity footprint calculation has been done using Ecoinvent v3.10 life cycle inventory database and LC-Impact assessment method. The Ecoinvent database contains more than 20,000 life-cycle datasets, which offer the possibility to assess the impact of e.g. climate change, toxicity, and land and water use. The IPCC 2021 impact assessment method has been used for climate change.
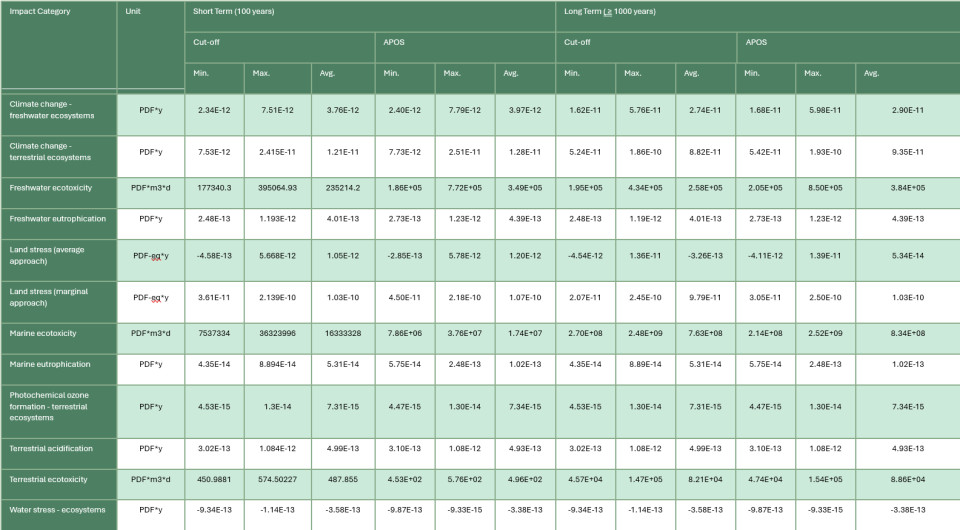
Calculations have been done using two different system models (cut-off and APOS). The system models differ in how they treat impacts of waste treatment and recovery of recyclable materials. The results of the biodiversity footprint are presented as short-term (100 years) and long-term (≥ 1000 years) results.
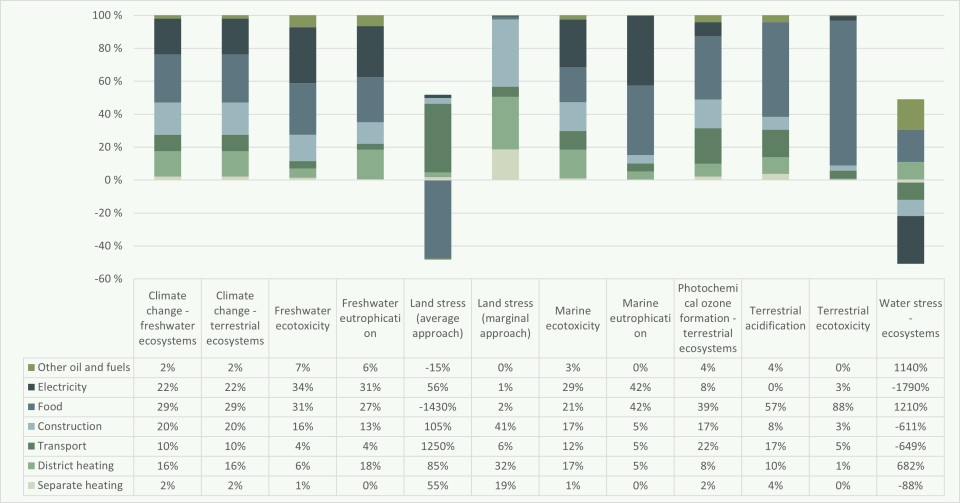
Calculations cover electricity consumed in the municipality, district heating, fuels for separate heating, consumption of other oil and other fuels, transport fuels, building materials used in the construction of new buildings as well as food consumption.
Results of the calculations are shown as the impact on nature for a total of twelve different ecosystem hazards. PDF (potentially disappeared fraction of species) is the unit of the biodiversity footprint, which describes the potential percentage of species at risk of extinction as a result of drivers causing harm to nature.
You can examine the images below more closely in the PDF files: 1) bar chart image and 2) table.
Espoo, Helsinki, Kangasala, Kauniainen, Liminka, Lohja, Pori, Riihimäki, Seinäjoki, Tampere, Turku, Vantaa and Ylöjärvi participated in the project.